
Solar Panel Output After 10 Years
A 10-year module warranty floor is a model-specific minimum power level, subject to the applicable warranty terms. It is not a forecast of measured output or annual energy production. The National Laboratory of the Rockies (NLR) reports a median inverter-level performance loss of 0.75% per year across 4,915 inverters in its PV Fleet data set. A constant loss of 0.5 percentage points per year leaves 87.5% of nameplate after 25 years, so it does not line up with an 80% year-25 promise.
NLR is a U.S. Department of Energy national laboratory. Its PV Lifetime Project says modules typically degrade slowly, often losing less than 1% of performance per year, which can leave that loss undetectable, within measurement uncertainty, for the first several years of operation. Use the warranty for the contractual floor and the fleet figure as a system-level benchmark. They answer different questions.
Two different 10-year numbers
A warranty floor is the minimum power the manufacturer promises, usually as a percentage of nominal power. Field performance loss is what operating systems have measured. NLR’s fleet page states that the median performance loss rate is 0.75% per year and that the chart’s P90 value is −1.9% per year. A companion NLR news summary of the same work says 90% of the systems lost less than 2% per year.
The same news report says systems in hotter temperature zones lost about twice as much as systems in cooler climates: 0.88% per year and 0.48% per year. That is a climate result, not a latitude formula. How much sunlight a site receives is a separate question from this measured loss rate.
For the 2008–2022 systems in that study, the median outage after an extreme weather event lasted two to four days and the median loss in annual performance was 1%. Twelve systems out of 6,400 were out for two weeks or more. That is the weather finding the fleet study published. It does not assign an extra yearly degradation rate to partial shade.
A 440 W example
The Qcells Q.TRON BLK M-G2+ page and the series datasheet, 415–440 Wp, Rev04 NA, state a power range of 415–440 W. The performance line on both keeps at least 98.5% of nominal power in the first year, then allows a maximum decrease of 0.33% per year, and keeps at least 90.58% of nominal power at 25 years. Those three statements fit one straight line: 98.5 − (24 × 0.33) = 90.58. The 24 steps are the years from the start of year 2 through the end of year 25.
The same datasheet states at least 95.53% of nominal power up to 10 years. That matches nine steps of 0.33 percentage points: 98.5 − (9 × 0.33) = 95.53. On a 440 W nameplate, the top of that power range, 95.53% is 420 W (440 × 0.9553 = 420.3). That 420 W figure is the warranty floor if the maximum allowed loss occurs every year. It is not a prediction that a particular roof will measure 420 W outdoors.
Formula and limits for this datasheet example: P_floor(y) = P0 × [98.5 − 0.33 × (y − 1)] ÷ 100. P0 is the module’s nameplate power in watts (W), using the 415–440 W power classes in the cited Q.TRON BLK M-G2+ 2024-08 Rev04 NA datasheet. Use whole warranty years 1–25: year 1 is 98.5%, year 10 is 95.53%, and year 25 is 90.58%. Year 0 is the original nameplate baseline, P0. Negative or fractional warranty years, zero or negative nameplate power, and years beyond 25 are outside this example. The datasheet specifies measurement tolerances and refers to the applicable country warranty terms.
Watts measure power; kilowatt-hours (kWh) measure energy. For a separate illustrative energy scenario using the first full monitored year E1 as year 1, E(y) = E1 × [1 − (r ÷ 100) × (y − 1)]. Use E1 > 0 kWh, whole years y ≥ 1 and a nonnegative loss magnitude r in percentage points of E1 per year; r = 0 means no assumed loss. A negative loss input would imply growth. Do not extrapolate to a negative remaining fraction. This scenario neither measures your system’s loss rate nor tests a module warranty.
For a separate linear sensitivity example, use the system-level fleet rates as assumptions applied to a 440 W year-0 starting point. These are illustrative equivalents, not module-specific measurements or warranty forecasts: 440 × (1 − 0.0075 × 10) = 440 × 0.925 = 407 W. A hotter-zone rate of 0.88% per year gives 440 × (1 − 0.0088 × 10) = 401 W. A cooler-zone rate of 0.48% per year gives 440 × (1 − 0.0048 × 10) = 419 W. Label each result with the source it came from. The warranty floor and the fleet median are not interchangeable.
| Basis | Rate used | Year-10 warranty floor or illustrative equivalent (W) |
|---|---|---|
| Q.TRON BLK M-G2+ warranty floor | 98.5% in year 1, then 0.33 points per year | 420 W |
| NLR fleet median, linear share of the start value | 0.75% per year | 407 W |
| NLR hotter temperature zones | 0.88% per year | 401 W |
| NLR cooler climates | 0.48% per year | 419 W |
An 80% year-25 promise is a different rate
Subtract a constant 0.5 percentage points of nameplate for 25 years and 12.5 points are gone. The remainder is 87.5%, not 80%. Reaching 80% after 25 years, with a constant share of nameplate lost each year, takes 20 ÷ 25 = 0.8 percentage points per year. Real warranties are often stepped rather than a single flat rate. The Q.TRON line above ends at 90.58% in year 25, which is higher than 80%.
First Solar’s Series 6 product page lists two current warranted annual degradation rates: −0.3% per year for Series 6 Plus bifacial modules and −0.1% per year for Series 6 Plus V2. The page says the −0.1% rate means Series 6 Plus V2 modules are guaranteed to retain at least 95% of original performance over a 30-year warranty. A cadmium-telluride warranty and a crystalline-silicon warranty can both be valid and still describe different floors. Read the sheet for the exact model on the roof.
Temperature coefficient is not the yearly loss
Qcells’ product page describes the temperature coefficient as the percentage of power lost as the temperature rises above 77°F, per degree Celsius. The series datasheet lists the temperature coefficient of maximum power as −0.30%/K. A lower coefficient means less instantaneous loss while the module is hot. First Solar publishes −0.32%/°C for Series 6 Plus bifacial modules and −0.22%/°C for Series 6 Plus V2. Those coefficients change power at a given temperature. They are not the multi-year performance-loss rate.
The climate evidence for long-term loss is the fleet split already cited: 0.88% per year in hotter temperature zones and 0.48% per year in cooler climates. NLR’s lifetime work is funded by the Department of Energy and uses careful indoor current-voltage measurements so a module’s degradation profile can be distinguished early in its life.
IEEE 1547 does not forecast degradation
NLR’s summary of IEEE Std 1547-2018 says the standard updates requirements for interconnecting distributed energy resources with the grid, including tripping, ride-through, and power quality. The same summary says the standard is not a design handbook or an interconnection agreement. Module aging, warranty floors, and 10-year energy estimates sit outside that scope. Use the module warranty and the fleet measurements for aging, and use IEEE 1547 when the question is how the inverter behaves on the utility grid.
How to use the forecast
- Copy the year-1 percentage, the later yearly maximum, and the year-25 percentage from the warranty for the exact model. Compute year 10 from those figures the way the Q.TRON line is computed above.
- Keep the first full year of monitored energy as the baseline. A percentage loss applies to energy the system produced, after inverter limits, shade, and soiling already present in that baseline.
- Treat a result below the warranty floor as a warranty question for the manufacturer, measured by the method the warranty names. Outdoor kilowatt-hours are not the same test as nameplate watts.
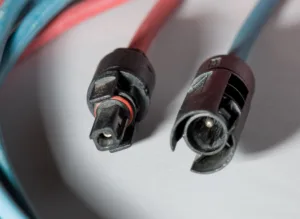
- If output falls in a way the monitoring system cannot explain, have a qualified installer inspect the array. Do not open module junction boxes or DC connectors to “verify” degradation.
Browse the solar panel and hardware topic guide for related module guides. If the issue is an inverter fault or monitoring problem rather than gradual module aging, use the solar inverter topic guide.
Sources: NLR PV Fleet Performance Data Initiative, NLR, extreme weather and fleet aging, NLR PV Lifetime Project, Qcells Q.TRON BLK M-G2+, Qcells Q.TRON BLK M-G2+ datasheet, Rev04 NA, First Solar Series 6, NLR highlights of IEEE Std 1547-2018.
Related Posts


Leave a Comment
Your comment will be published after it has been approved. Please send comments that do not contain slang words.