
Solar Panel Monitoring Apps
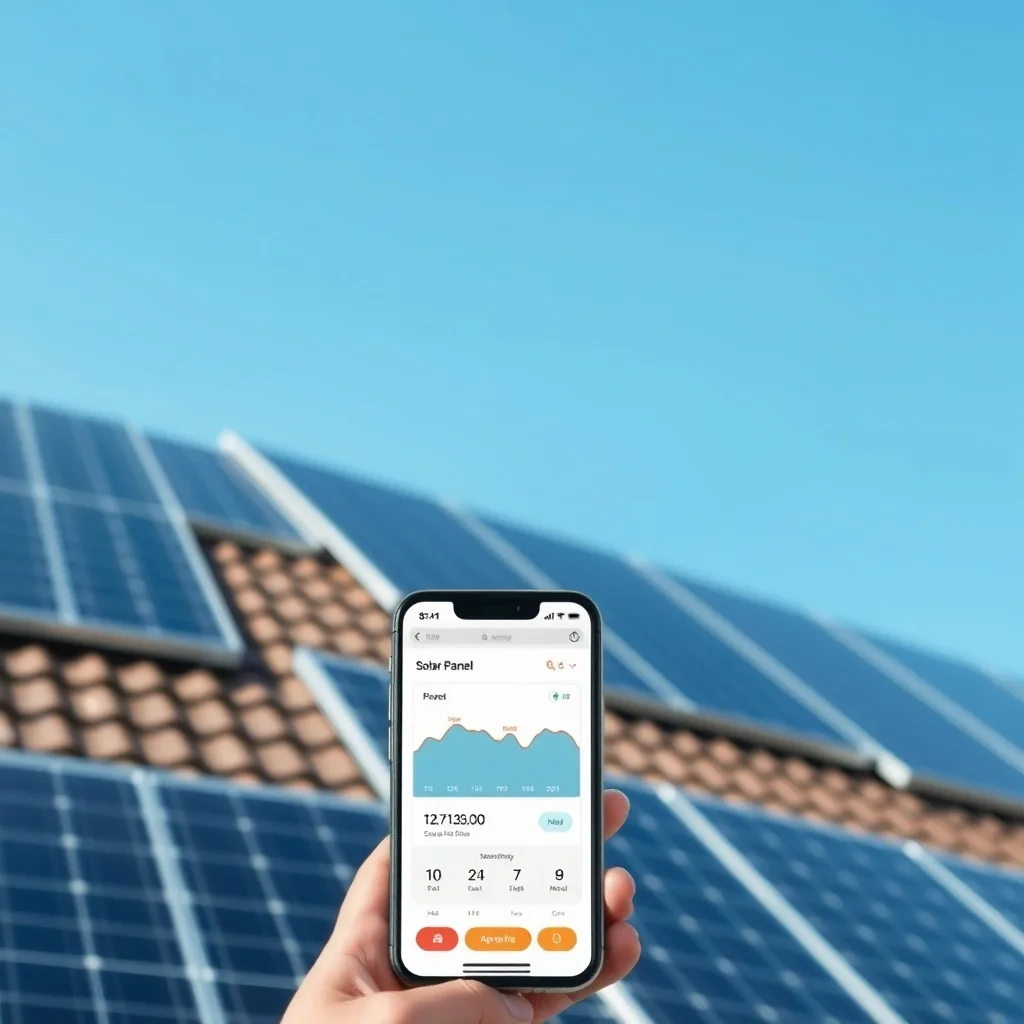
A solar panel monitoring app shows how much energy your system produces, when it produces it, and whether anything has gone wrong. The best apps go further: they flag a dead string, a tripped inverter or a shaded panel within hours instead of months. This guide explains what a good app must show, how the main app types differ, when panel-level data is worth paying for, and how to set alerts that catch real faults without spamming you.
Table of Contents
- What a Good Monitoring App Shows
- App Types Compared
- How to Read the Numbers
- Is Panel-Level Monitoring Worth It?
- Setting Up Useful Alerts
- Data, Privacy and What Happens If the App Dies
- FAQ
What a Good Monitoring App Shows
A good monitoring app shows production, consumption and system status on one screen. Production is the energy your panels generated, usually in kilowatt-hours (kWh) per day and kilowatts (kW) right now. Consumption is what your home used. The gap between them is what you exported to the grid or imported from it.
The status line matters more than the pretty graphs. It tells you whether the inverter is online, whether every string is reporting, and whether a fault code is active. If an app cannot show a fault code, it is a dashboard, not a monitor.
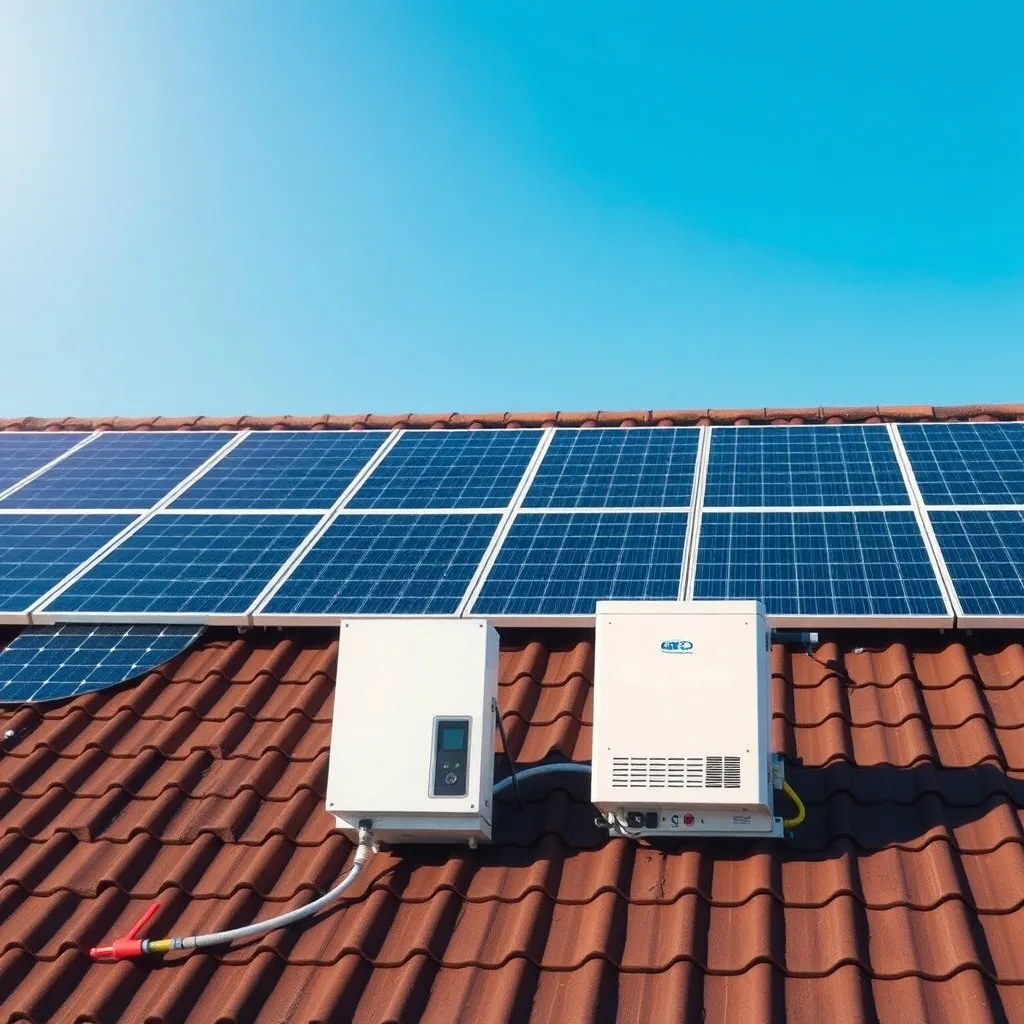
Here is the minimum data set to expect from any serious app:
- Live power (kW) refreshed at least every 5 to 15 minutes.
- Daily, monthly and lifetime energy (kWh) with a way to export the raw data.
- Inverter status and fault codes in plain language, with the numeric code included.
- Per-string or per-panel output if your hardware supports it.
- Grid voltage and frequency, because many “mystery” shutdowns are grid events, not panel faults.
- Battery state of charge if you have storage.
Inverter data is the source of almost everything above. The U.S. Department of Energy explains in its inverter and grid services basics that modern inverters already measure voltage, frequency and power constantly to stay synchronised with the grid. The app simply reports what the inverter already knows.
App Types Compared
There are three kinds of solar monitoring app, and each answers a different question. The manufacturer app answers “is my inverter healthy?”. A consumption monitor answers “where is my electricity going?”. A third-party aggregator answers “how does my system compare over time and across brands?”.
| App type | Data source | Best for | Typical gap |
|---|---|---|---|
| Manufacturer app (Enphase App, SolarEdge, Fronius Solar.web, SMA Energy, Huawei FusionSolar, Tesla) | Your inverter or microinverters via Wi-Fi or Ethernet | Fault codes, per-panel data, warranty claims | Usually no home consumption unless you add a meter |
| Consumption monitor (Sense, Emporia Vue, IoTaWatt) | Clamp meters on your main panel | Seeing which appliances eat your solar | No inverter diagnostics; solar is just a number |
| Third-party aggregator (PVOutput, Solar Analytics, Home Assistant integrations) | API pull from the inverter cloud or a local meter | Long-term history, mixed-brand systems, custom alerts | Depends on the manufacturer keeping its API open |
| Utility portal | Your smart meter | Verifying export credits on the bill | Only sees net flow at the meter, often with a one-day delay |
Most homeowners need two of these: the manufacturer app for diagnostics and either a consumption monitor or the utility portal for the bill side. If you only install one, install the manufacturer app. It is the only one that can tell you a panel has failed. We cover the manufacturer apps brand by brand in our solar inverter monitoring app guide.
How to Read the Numbers
The single most useful number is daily kWh compared with the same day last year, or with a clear-sky expectation. A 5 kW system on a clear summer day should produce roughly 20 to 30 kWh, depending on climate and tilt. On an overcast winter day, 3 to 8 kWh is normal. A sudden drop to zero on a sunny day is a fault. A slow decline of a few percent per year is ageing and dust.
Two habits make the graphs meaningful:
- Look at the shape, not just the total. A healthy daily curve is a smooth bell. A flat top means the inverter is clipping. A notch at the same time every day means a shadow from a chimney, tree or neighbouring roof. A ragged curve is usually clouds.
- Compare strings or panels against each other, not against a spec sheet. All panels on one roof plane see the same sun. If one string reads 30% lower than its twin, something is wrong with that string, whatever the datasheet says.
The Department of Energy’s note on PV performance and efficiency basics is a useful reminder that real-world output always sits below the nameplate rating because of temperature, soiling, wiring losses and inverter conversion. Your app is measuring the real number, so do not panic when it never hits the sticker value.
Is Panel-Level Monitoring Worth It?
Panel-level monitoring is worth it when your roof has shading, multiple orientations or more than about 12 panels. It is optional on a small, unshaded, single-plane array where a string reading tells you almost the same thing.
Panel-level data comes from microinverters (Enphase, APsystems, Hoymiles) or DC optimisers (SolarEdge, Tigo). Each unit reports its own voltage, current and power. The app then draws a roof map with a number on every panel.
What it buys you in practice:
- Faster fault location. A failed panel or connector shows up as one dark tile, so the installer arrives with the right part.
- Proof for warranty claims. Manufacturers ask for production history. Per-panel logs settle arguments quickly.
- Shading truth. You can see exactly which panels a tree affects, and when, before deciding whether to trim it.
What it does not do: it does not increase your energy production by itself. The hardware (microinverters or optimisers) may recover some shading losses; the app merely reports it. If a salesperson sells “monitoring” as a production gain, ask which hardware is doing the work.
Setting Up Useful Alerts
Useful alerts are few, specific and tied to a fault you would act on. Turn on the ones below and turn off the daily “you produced X kWh” summary, which trains you to ignore notifications.
| Alert | Trigger to set | Why it matters |
|---|---|---|
| Inverter offline | No data for more than 2 hours during daylight | The most common silent failure; systems have sat dead for months |
| Zero production | 0 kWh on a day when the local forecast was not fully overcast | Catches tripped breakers and blown fuses |
| String or panel imbalance | One string or panel more than 20% below its peers for 3 consecutive days | Points to a connector, bypass diode or soiling issue |
| Grid fault code | Any over/under-voltage or frequency event | Repeated grid trips can justify a utility complaint or a settings change |
| Battery not charging | State of charge unchanged over a sunny day | Storage faults are easy to miss when the panels still work |
| Communication loss | Gateway offline for 24 hours | Not a solar fault, but you lose all history until it is fixed |
Set the offline threshold to hours, not minutes. Wi-Fi hiccups are normal and a 15-minute trigger will make you switch alerts off entirely. If your app cannot do conditional alerts, a free aggregator such as PVOutput or a Home Assistant automation can add them on top.
When an alert fires and you are not sure what it means, walk through our step-by-step underperformance diagnosis before calling the installer. Many “faults” are a breaker, a dirty panel or a clipped afternoon, all of which you can check yourself. More self-checks live in the solar maintenance and DIY section.
Data, Privacy and What Happens If the App Dies
Your monitoring data lives on the manufacturer’s servers, not on your phone. That has two consequences. First, the company can see your production and, if you added a meter, your consumption pattern. Read the privacy policy if that bothers you. Second, if the company stops supporting your inverter model, the app can stop working while the hardware still runs fine.
Three defensive steps cost nothing:
- Export a CSV of your history once a year and keep it. Warranty claims and house sales both benefit.
- Check whether your inverter offers local access (Modbus TCP, a built-in web page or an open API). Local access survives a cloud shutdown.
- Keep the installer’s commissioning report. It records the expected first-year yield, which is the baseline every later comparison depends on.
FAQ
Do I need a separate app for solar monitoring?
Usually yes, at least one. The inverter manufacturer’s app is the only source of fault codes and per-string data. Utility portals only show net flow at the meter.
How often should a solar monitoring app update?
Every 5 to 15 minutes is typical for cloud apps. Some local systems update every few seconds. Anything slower than hourly makes fault detection slow.
Why does my app show less production than the system size?
Real output is always below the nameplate rating because of temperature, panel angle, soiling, wiring losses and inverter conversion. A 6 kW array rarely shows 6 kW on the app, even at noon.
Can a monitoring app tell me which panel is broken?
Only if you have microinverters or DC optimisers, which report each panel separately. With a plain string inverter the app can only show the affected string.
Is panel-level monitoring worth the extra cost?
It is worth it on shaded, multi-orientation or larger roofs, and for warranty evidence. On a small unshaded roof, string-level data tells you almost as much.
What if the manufacturer stops supporting the app?
The inverter keeps producing; you lose the dashboard. Prefer inverters with local access or an open API, and export your history to CSV each year.
Related Posts
Leave a Comment
Your comment will be published after it has been approved. Please send comments that do not contain slang words.