
Solar Panel Degradation Rate
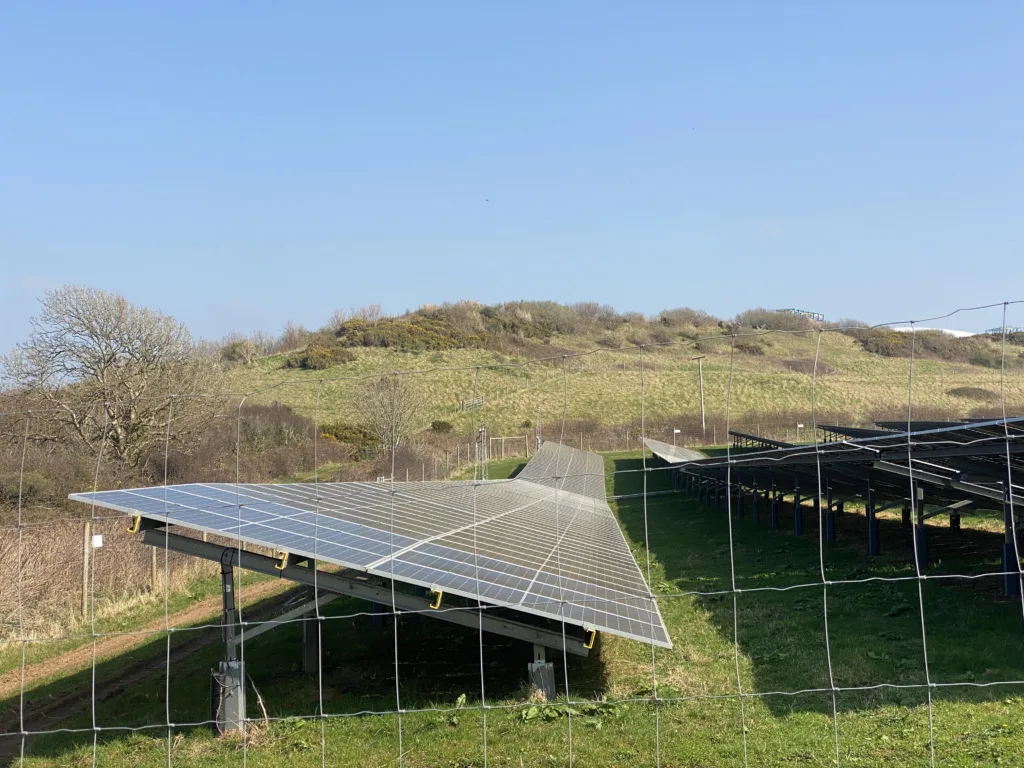
Solar panel degradation rate – how much a panel’s output declines each year – is one of the most important numbers in a realistic long-term production and payback estimate, yet it’s often glossed over in sales materials in favor of a simple headline efficiency percentage. Understanding real degradation rates helps set accurate expectations for year 15 or year 25 production, not just year one.
This guide covers what degradation rate actually means. It covers typical rates by panel generation and manufacturer tier, and what causes degradation. It also covers how to factor it correctly into a long-term production and financial estimate.
Table of Contents
- What Degradation Rate Actually Means
- Typical Degradation Rates by Panel Type
- What Causes Degradation
- Performance Warranty vs. Actual Measured Degradation
- A Worked 25-Year Example
- Factors That Affect Real-World Degradation
- How to Read a Manufacturer’s Degradation Guarantee
- Measuring Actual Degradation on Your System
- Degradation vs. Soiling
- Degradation and System Resale Value
- Common Mistakes
- Frequently Asked Questions
What Degradation Rate Actually Means
Degradation rate is the annual percentage decline in a panel’s power output compared to its rated nameplate capacity. It is caused by gradual, expected material aging. It is not a defect or malfunction. Every crystalline silicon panel degrades gradually over its life. The question is how much per year. That directly determines how much power the system still produces at year 15 or 25, compared to when it was new.
Typical Degradation Rates by Panel Type
| Panel Generation | Typical Annual Degradation | Approximate Output at Year 25 |
|---|---|---|
| Older standard mono-PERC (first year higher, then steady) | ~0.5-0.7%/year after an initial ~2% first-year drop | ~83-88% |
| Current-generation mono-PERC | ~0.4-0.5%/year | ~87-90% |
| TOPCon | ~0.3-0.4%/year | ~90-92% |
| Premium HJT/heterojunction | ~0.2-0.3%/year | ~92-95% |
These are general industry-observed ranges, not guarantees for any specific product – always check the specific manufacturer’s stated and warrantied degradation rate for the exact panel being quoted.
What Causes Degradation
Panel degradation stems from several gradual material-aging mechanisms. Light-induced degradation causes a small initial drop in the first weeks or months of exposure, now much reduced in current-generation cells. Thermal cycling stress comes from daily heating and cooling. UV exposure gradually affects encapsulant materials. And minor moisture ingress occurs over very long timescales, despite sealed construction. None of this is a sign of a defective panel – it’s expected, gradual material aging that manufacturers account for explicitly in their performance warranties.
Performance Warranty vs. Actual Measured Degradation
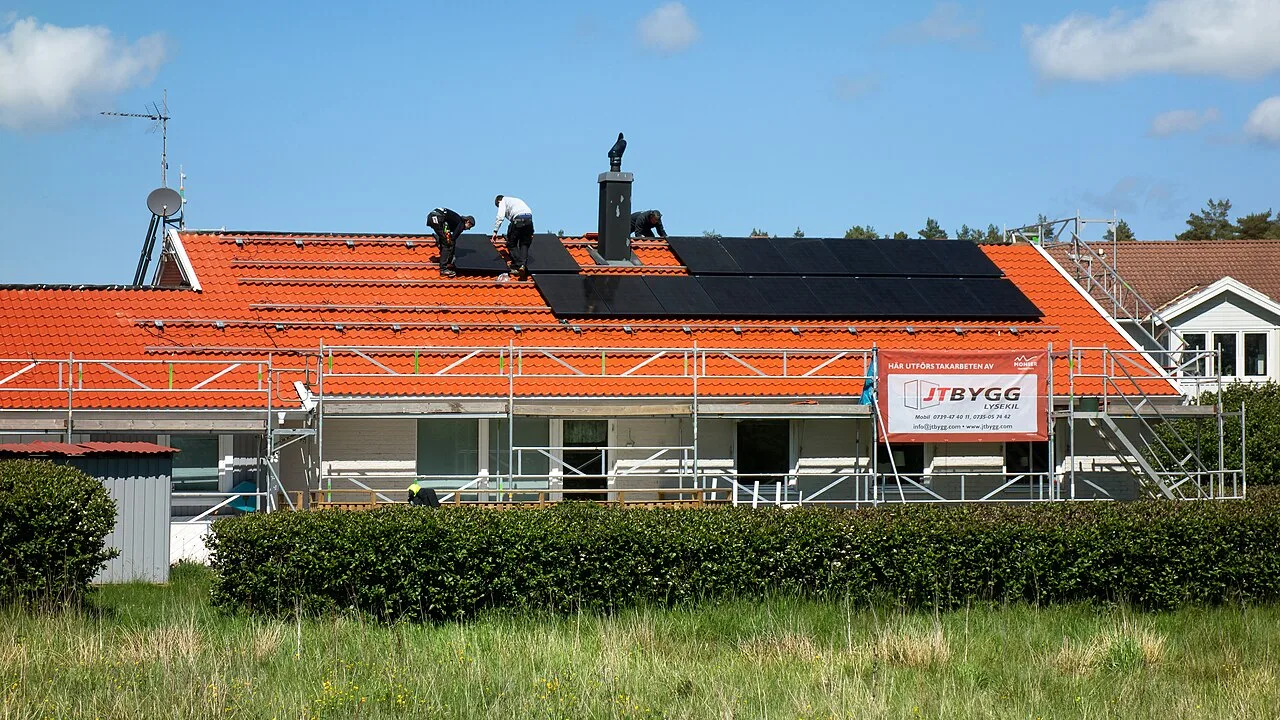
A manufacturer’s performance warranty states a guaranteed minimum output floor at specific years. Common terms guarantee something like 90% or more at year 10, and 85 to 92% at year 25, varying by brand. This is a legal minimum guarantee. It is not necessarily the panel’s actual expected performance. Independent field studies have generally found quality current-generation panels performing at or better than their warranted minimums. This varies by manufacturer and installation conditions. The warranty is a floor to rely on, not necessarily the number to expect on average.
A Worked 25-Year Example
Take a 10kW system rated for 0.4% per year degradation, which is a solid current-generation TOPCon panel. Starting at 100% nameplate output, it would be expected to produce roughly 90% of its original output by year 25. An older-generation panel degrading at 0.6 to 0.7% per year would land closer to 83 to 85% by the same point. Over 25 years, that difference compounds into a real gap in total lifetime energy production. That is why degradation rate deserves real weight in a long-term financial comparison between panel options. Headline efficiency and price are not the whole story.
Factors That Affect Real-World Degradation
- Climate – consistently hot climates generally see somewhat higher degradation than moderate climates, given increased thermal cycling stress.
- Installation quality – proper mounting, ventilation, and wiring reduce unnecessary thermal and electrical stress.
- Panel quality and manufacturing consistency – reflected in, though not perfectly predicted by, manufacturer tier and warranty terms.
- Maintenance – minimal maintenance is generally needed, but consistent severe soiling left unaddressed can compound with true degradation to look like a bigger decline than the panel’s actual material aging.
How to Read a Manufacturer’s Degradation Guarantee
Look for the specific guaranteed output percentage at both year 10 and year 25, or whatever years the manufacturer states. A single 25-year warranty headline is not enough. Two panels both advertising a 25-year warranty can guarantee meaningfully different output floors at that point. Also check whether the warranty is linear, meaning a steady annual decline, or follows a different-shaped guarantee curve. Some warranties specify a slightly different first-year drop followed by a steadier rate. This affects the exact guaranteed output at any intermediate year, not just the endpoint.
Measuring Actual Degradation on Your Own System
Most current monitoring apps let you compare production for the same calendar period across different years. That is the most practical way to estimate your own system’s real degradation rate over time. A true year-over-year comparison for the same month, adjusted for obvious weather differences, gives a reasonable estimate after a few years of data. Be cautious about drawing conclusions from just one or two years of data. Normal weather variation between years can be larger than a typical single year’s degradation. A genuinely reliable estimate benefits from several years of comparable data, or a professional performance test if you need precision sooner.
Degradation vs. Soiling: Telling Them Apart
A production decline that looks like degradation is sometimes accumulated soiling from dust, pollen, or bird droppings. A simple panel cleaning resolves that. Genuine degradation does not improve after cleaning, since it reflects permanent material aging rather than a removable surface layer. If you notice a production drop, check whether a cleaning restores most of the lost output before assuming it reflects the panel’s actual degradation rate. Conflating the two can lead to incorrectly concluding a panel is degrading faster than its actual warranted or typical rate.
Degradation and System Resale Value
When selling a home with an existing solar system, a buyer or appraiser should account for expected degradation. A 10-year-old system still has meaningful remaining life and value. It is not producing at its original nameplate capacity, though. Any valuation or disclosure should reflect actual measured or reasonably estimated current output, not the system’s original specifications. If you are selling a home with solar, bring recent monitoring data showing actual current production. Relying solely on the original installation specs is weaker. Real data gives a more credible, defensible basis for the system’s value to a buyer’s inspector or appraiser.
Common Mistakes
- Ignoring degradation rate entirely in a payback/ROI estimate – assuming flat output for 25 years overstates long-term production.
- Comparing only headline warranty length without checking the guaranteed output percentage – two “25-year” warranties can guarantee different output floors.
- Confusing the manufacturer’s warranty floor with expected average performance – real-world performance for quality panels often exceeds the warranted minimum.
- Assuming all degradation issues indicate a defective panel – gradual, expected degradation within warranted rates is normal, not a problem.
Frequently Asked Questions
What is a “good” solar panel degradation rate?
Under 0.5%/year is solid for current-generation panels. Premium HJT panels can reach 0.2-0.3%/year – always compare the specific manufacturer’s stated and warrantied rate for the exact product.
Does degradation mean my panels are getting worse or breaking down?
No – it’s expected, gradual material aging built into every crystalline silicon panel’s design and warranty, not a sign of defect or malfunction.
How much power will my panels produce at year 25?
Depends on the specific panel’s degradation rate – commonly somewhere in the 83-95% range of original output for quality current-generation panels, varying by cell technology and manufacturer.
Should I factor degradation into my payback period calculation?
Yes – assuming flat output for 25 years overstates long-term production and can make payback and total-ROI estimates look better than reality. See our payback period calculator for the fuller calculation.
Is degradation rate the same as the performance warranty guarantee?
Related but not identical – the warranty guarantees a minimum output floor (a legal commitment), while actual measured degradation for quality panels often performs somewhat better than that floor in practice.
How can I check my own system’s actual degradation rate?
Compare production for the same calendar month across different years using your monitoring app’s historical data – several years of comparable data gives a more reliable estimate than just one or two years, given normal weather variation.
My production dropped noticeably – is that degradation or something else?
Check whether a panel cleaning restores most of the lost output first – soiling is a common, removable cause of production drops that’s easy to confuse with permanent degradation.
Conclusion
Solar panel degradation rate is a real, quantifiable factor. It meaningfully affects long-term production and financial return. Compare the specific guaranteed output percentages at year 10 and year 25 across products, rather than relying on headline warranty length alone. See our best solar panel brands guide and payback period calculator for the related decisions this feeds into.
Further reading: NREL – Photovoltaic Degradation Rates Research and Wikipedia – Solar panel.
Distinguishing real degradation from soiling or shading is a monitoring habit. Our panel maintenance guide covers how to read production data and diagnose a drop.
For the long view on ageing arrays, read what happens after 25 years.
Related Posts
Leave a Comment
Your comment will be published after it has been approved. Please send comments that do not contain slang words.